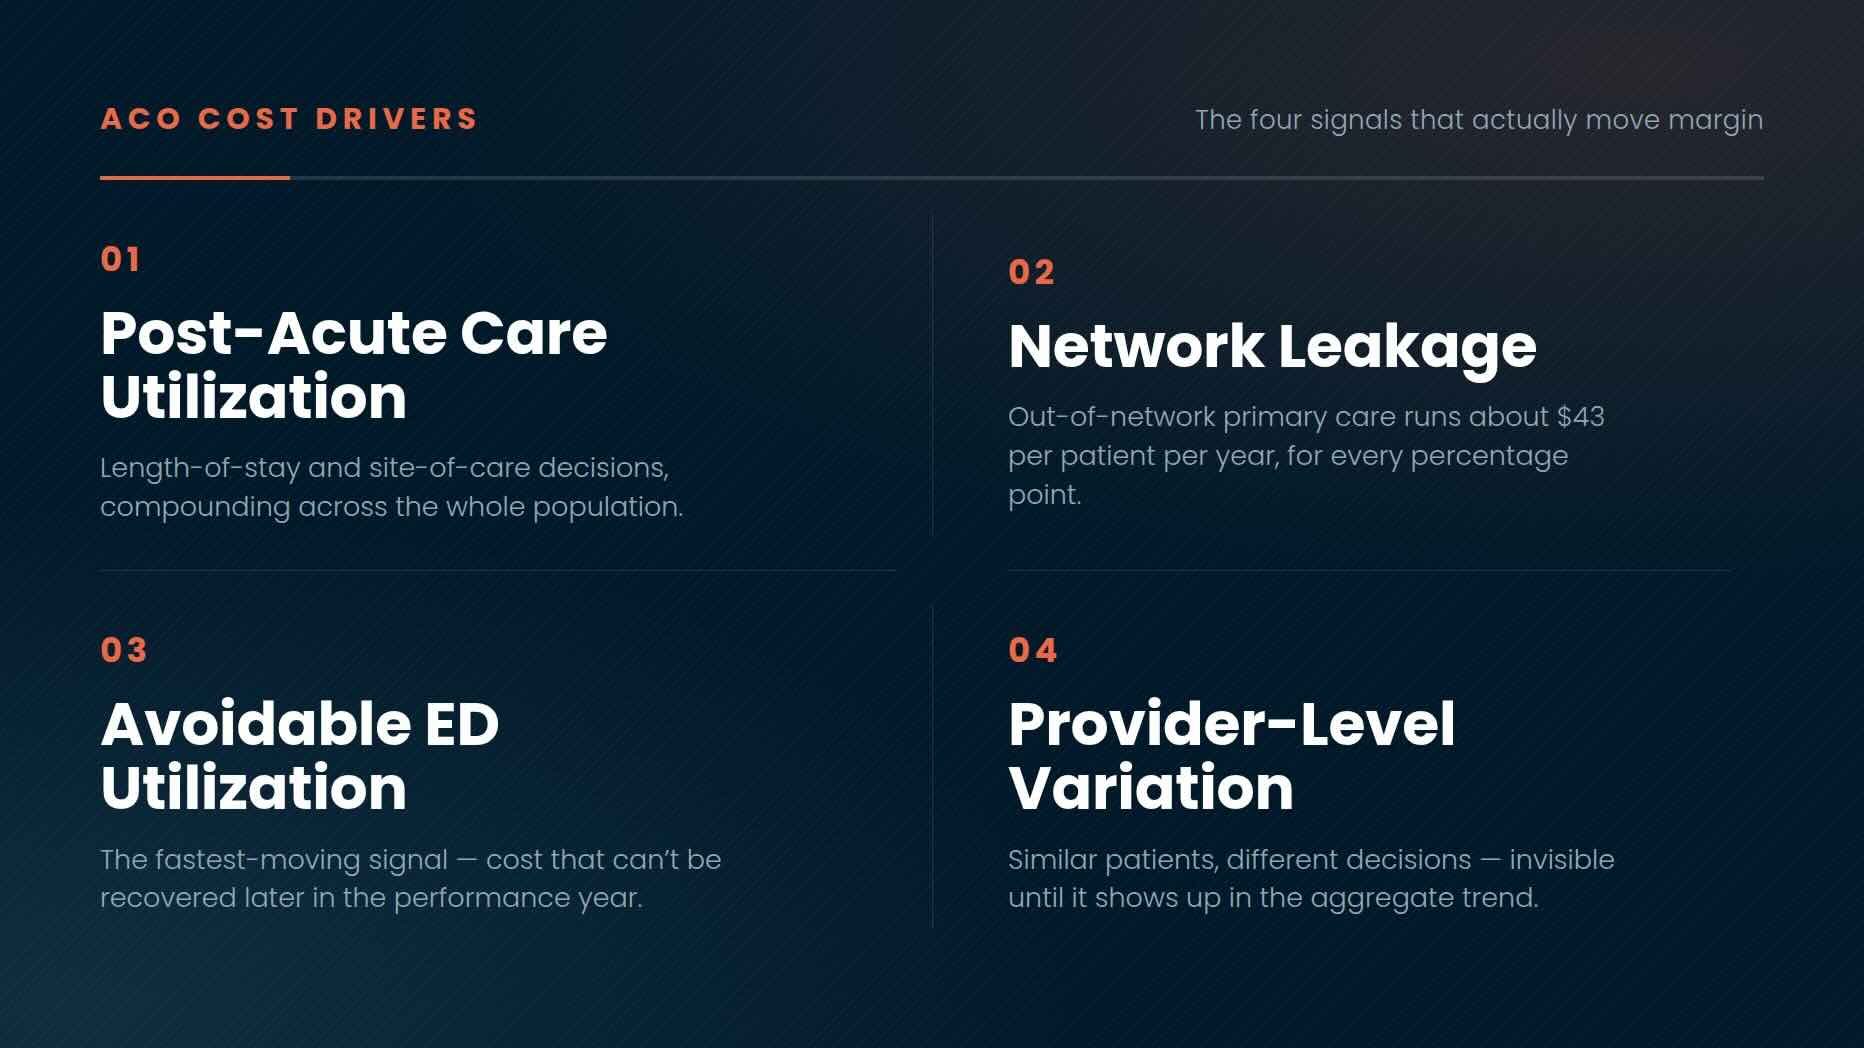


Accountable Care Organization (ACO) cost overruns rarely come from one big problem. They come from four specific, controllable signals: post-acute care utilization, network leakage, avoidable emergency department (ED) visits, and provider-level variation in how similar patients are managed. Benchmarks are fixed once set by the Centers for Medicare & Medicaid Services (CMS); utilization is not. The ACOs that consistently protect margin aren’t the ones with the most reporting — they’re the ones that can see these four signals early enough to act before the performance year locks in.
That distinction matters because most ACO cost variation happens at the point of care, not at the organizational level: a length-of-stay decision at a skilled nursing facility (SNF), a referral sent out of network out of habit, an ED visit that could have been a same-day primary care slot. By the time these patterns show up in claims data, the spending has already happened. This article breaks down each of the four signals, what the data shows about their financial weight, and what ACOs achieving real margin improvement are doing differently—illustrated with verified client outcomes.
Why Cost Control Is Harder Than It Sounds
Reducing cost sounds simple: cut unnecessary utilization, improve efficiency. In practice, cost in an Accountable Care Organization (ACO) is driven day to day, decision by decision, across providers and care settings—not at the program level. Three patterns explain why control is so often lost: variation is decentralized (providers manage clinically similar patients very differently, especially in post-acute referrals and ED use), signals arrive late (claims data reflects behavior that already happened weeks or months earlier), and accountability is diffuse (without provider-level visibility, it’s hard to trace a cost pattern back to a specific decision). None of this means cost is uncontrollable—it means the four signals below need to be tracked at the provider and patient level, not just the population level.
Signal 1: Post-Acute Care Utilization
Post-acute care (PAC) is usually the single largest opportunity in an ACO’s cost structure, because small differences in length of stay and site-of-care decisions compound across an entire population. CMS’s own PY2024 results confirm the direction: ACOs that earned shared savings had lower utilization than their benchmark across hospital discharges, emergency department visits, and skilled nursing facility stays. Within the same ACO, similar patients are routinely managed differently — some discharged with appropriate home support after a shorter stay, others referred to higher-cost settings or held longer than clinically necessary, without a documented reason.
The variation shows up in a few specific places: length-of-stay differences across providers and facilities, referral patterns into SNFs, long-term acute care hospitals, and inpatient rehabilitation facilities, and use of higher-cost settings when a lower-cost option would serve the patient just as well. Each of these is a repeatable, trackable decision — which means each is also a lever. One Koan Health client used its analytics platform to discover a regional home health agency was recertifying patients well beyond clinical necessity — a pattern that had gone unnoticed until provider- and facility-level data made it visible.
Signal 2: Network Leakage
Network leakage—care that moves outside an ACO’s preferred network—quietly touches almost every other performance metric, because Medicare attributes beneficiaries to ACOs based on which organization delivers the plurality of their primary care. When a primary care visit happens out of network, an ACO risks three things at once: the fee-for-service revenue from that visit, the ability to close quality and Hierarchical Condition Category (HCC) documentation gaps during that encounter, and—if the pattern continues—the patient’s attribution itself the following year.
Beginning in 2025, CMS expanded its attribution methodology to include beneficiaries whose primary care comes from nurse practitioners, physician assistants, and clinical nurse specialists, a change estimated to add more than 760,000 beneficiaries to ACO attribution nationally. That expansion raises the stakes on capturing every primary care touchpoint, not just physician visits.
Here the evidence overturns a common assumption. It is tempting to chase specialist leakage first, because specialist referrals carry bigger per-visit dollar amounts. A Health Affairs study of 1.6 million Medicare beneficiaries found the opposite: specialty care leakage was not associated with higher ACO spending at all, while primary care leakage was. Each additional percentage point of out-of-network primary care visits cost an ACO roughly $43 more per patient per year, with the excess driven by outpatient care, emergency visits, and skilled nursing stays. The authors estimated that cutting out-of-network primary care across all Medicare ACOs by one-tenth of a percentage point would save Medicare about $45 million annually.
The mechanism is straightforward: primary care providers act as gatekeepers, and an in-network primary care provider manages referrals toward more cost-effective care. Leakage in that relationship doesn’t just cost one visit — it redirects everything downstream of it.
Leakage is also more prevalent than most ACOs assume. One frequently cited MSSP analysis found 32.9% of total expenditures went to out-of-ACO providers, with 89.8% of beneficiaries receiving some out-of-network care.
Signal 3: Avoidable Emergency Department Utilization
Emergency department (ED) utilization is the fastest-moving of the four signals, because it creates cost that can’t be recovered later in the performance year—unlike post-acute care or network leakage, where a mid-year correction can still change the annual trend. CMS’s PY2024 results showed ACOs earning shared savings achieving lower ED utilization alongside lower hospital discharges and SNF stays—the clearest available signal that ED management separates financial performers from the rest.
The issue isn’t just volume—it’s the type of visit. A high rate of ED visits that end in discharge rather than admission is usually a signal of limited primary care access, gaps in care coordination, or patients defaulting to the ED because they don’t have a faster alternative. Those are operational problems, not clinical inevitabilities, and they respond to operational fixes: identifying repeat utilizers, flagging which providers’ patient panels are driving above-average visit rates, and building a care-coordination response—patient education, care coordinators, and proactive outreach—around the patients most likely to return.
Signal 4: Provider-Level Variation in Similar Patients
Underneath the first three signals is a common root cause: two providers managing clinically similar patients can produce very different cost outcomes, and without provider-level data, that variation is invisible until it shows up in the aggregate trend.
Three patterns account for most of it. Cost outliers—providers, service lines, or patient cohorts consistently driving higher-than-expected spend. Unwarranted variation—clinically similar patients managed inconsistently for no documented reason. And referral habit—established relationships that route patients to the same specialists regardless of network status or cost profile, which is rarely a deliberate decision and almost never revisited without data.
All three point to the same fix: provider-level scorecards and benchmarking that make variation visible enough to support a specific, data-backed conversation with a specific provider — rather than a general appeal to the group about managing cost.
Turning Signals Into Action: A Provider-Engagement Workflow
Seeing these four signals is only half the job—the other half is connecting analytics to a workflow that reaches providers before the performance year closes. The ACOs that do this consistently share a few practices: timely insight (visibility into post-acute, leakage, and ED patterns early in the performance year, not at year-end reconciliation), focused workflows (care management resources aligned to the highest-risk patients and the specific drivers above, rather than spread evenly across the population), provider scorecards (individual and group-level utilization and referral data shared regularly enough to change habits), and clear financial framing (translating a utilization pattern into the dollar amount it represents, so the conversation with a provider is about impact, not just metrics).
What This Is Worth: Real ACO Outcomes
The financial upside of getting these four signals right is not theoretical. In performance year 2024, 75% of 476 MSSP ACOs earned performance payments totaling $4.1 billion, and Medicare saved $2.5 billion relative to benchmarks—with net per-capita savings of $245, up from $207 the prior year. ACOs that earned savings showed lower utilization across exactly these categories.
On the client side, the pattern holds at the individual-ACO level too. A multi-state ACO used Koan Health’s Datalyst™ platform to uncover a home health agency’s pattern of unnecessary recertifications, achieving a 13% reduction in home health recertifications per member per year and saving roughly $6 million. Separately, a regional ACO managing 200,000 lives combined targeted intervention, patient education, and dedicated care coordinators to reduce avoidable ED visits by 20%—44 fewer visits per 1,000 patients — while improving how ED resources reached genuinely urgent cases.
.svg)